Date: March 24, 2022
Time: 5:30 p.m. PT
Share Report Templates- You asked, we listened! You can now share Report Templates with other users who have been added to Reporting+.
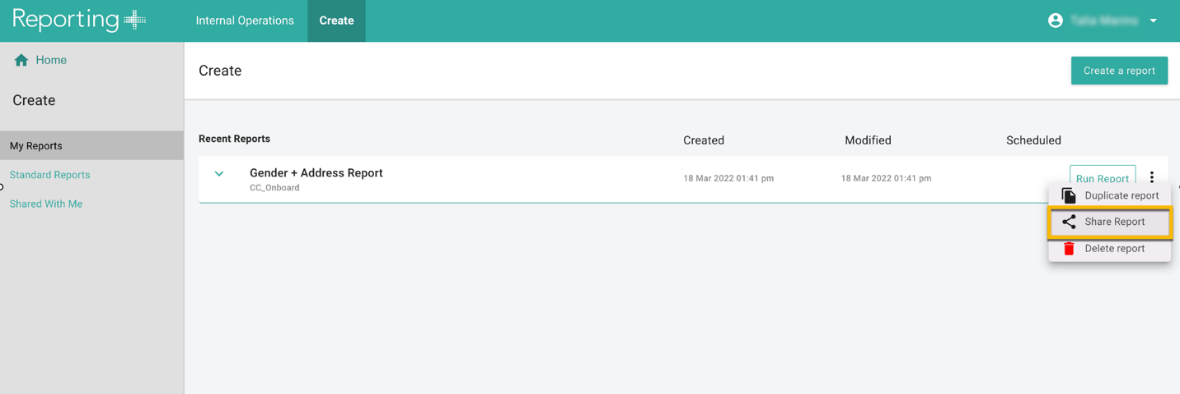
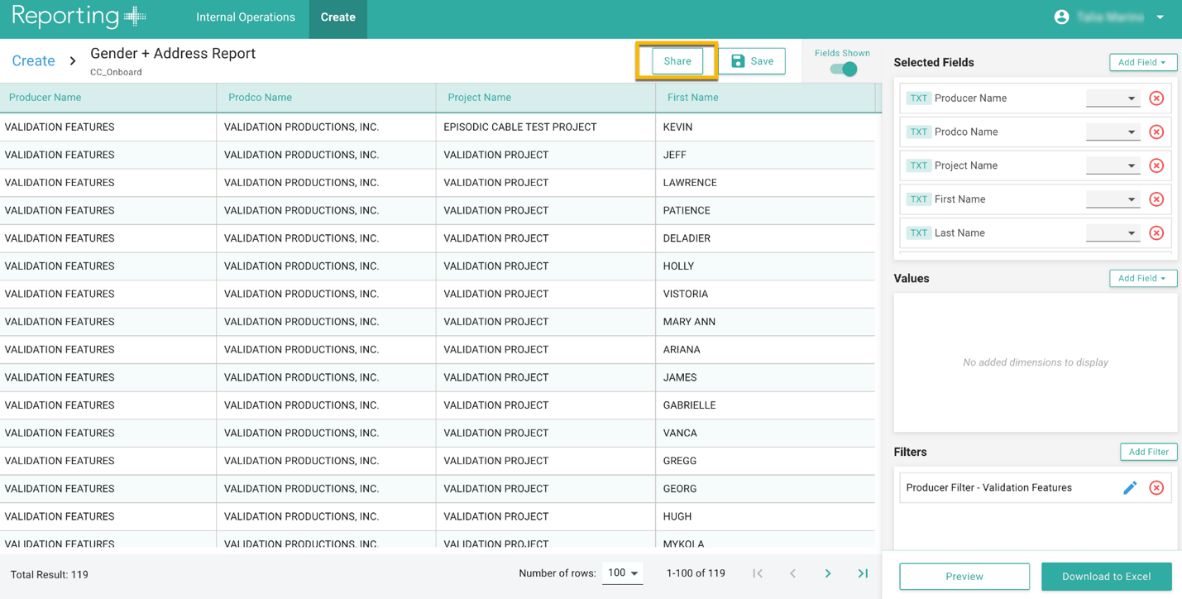
- You can share templates by either clicking “Share Report” from the 3-dot menu under your My Reports list or by clicking the “Share” button on the top of the report grid when viewing a report:
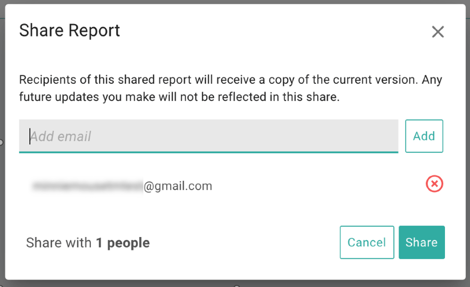
- Then, enter one or more email addresses in the Share Report window to easily share the template.
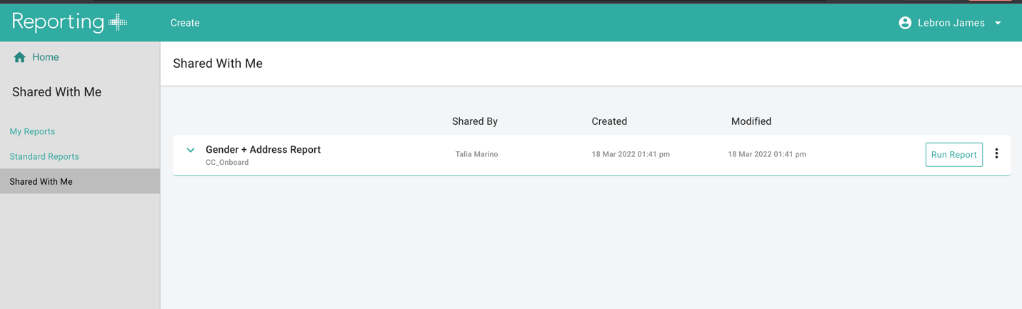
- If the recipient has been given access to Reporting+, they will see the report appear in the new “Shared with Me” list.
- The recipient of the shared report template can now Run and Save this report and their own copy will be saved under their My Reports list for future use:
- If the recipient has not yet been given access to Reporting+, you will receive an error notification letting you know the report was not able to be shared.
- Important Note: The Share Report feature will NOT share any of the actual data in the report with your recipient(s). It will only share the report configuration (fields included, aggregations, and applied filters). Your recipients will only be able to view the data that they already have access to when they run the report template that was shared with them. Additionally, changes made to either the original report template or the shared template by either the sender or recipient, respectively, will not be reflected in the other version.
Improvements to Filters
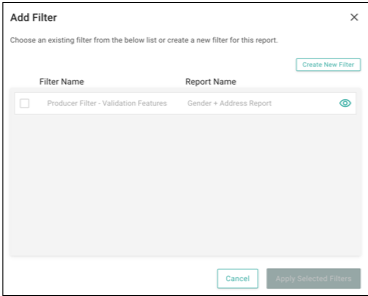
- Filters are now associated with the specific report within which they were originally created
- The report name will now be displayed in the Add Filter window next to the filter with which it was given.
- You can still reuse/add existing filters to other reports. When this happens, a new instance of the filter will automatically be created and appear with the new report name specified:
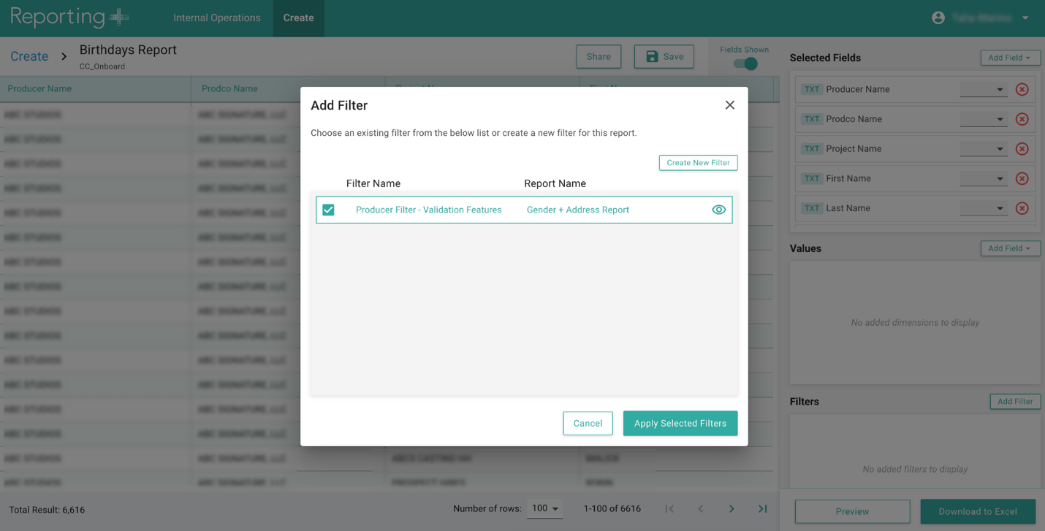
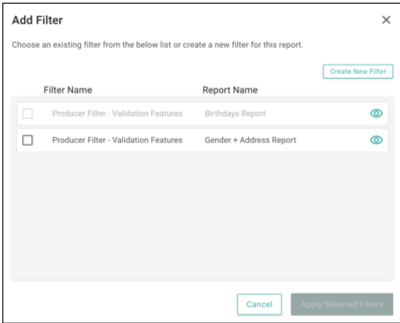
- The report name will now be displayed in the Add Filter window next to the filter with which it was given.
- You can now also preview the content of an existing filter by clicking the
 icon in the Add Filter window:
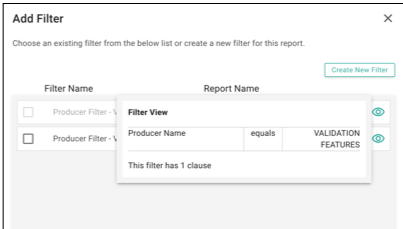
- In order to delete an existing Filter, it must either be deleted directly from the Report in which it was created by clicking the
 in the Filters container for that specific report OR by deleting the Report itself in which the filter was created:
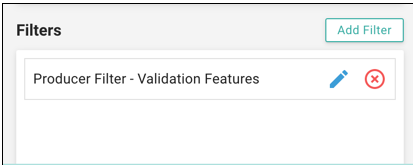
- The “Loan-out” and “Tax ID Number” (masked) fields are now available in the timecard data source (they previously were only available in the onboard data source).
- Need more rows of data in your reports? We’ve upgraded the limit to 1 million rows.
-
- Keep in mind that the Download to Excel feature supports file sizes up to 5MB.
- The number of columns in a report will impact the total file size.
-
- This means that you could have less than 1 million rows in your preview on the screen, but the file may not generate an Excel download if the total size of the file, based on the amount of data and columns therein, exceeds the 5MB limit.
-
- You will need to either remove some columns or filter the data further in order to successfully Download to Excel when this occurs.
Associated Help Center Guides: