| Check out all of our Reporting+ courses in Learning On-Demand. |
This article shows you how to perform this task in both Classic and New experiences.
Steps for Classic Experience
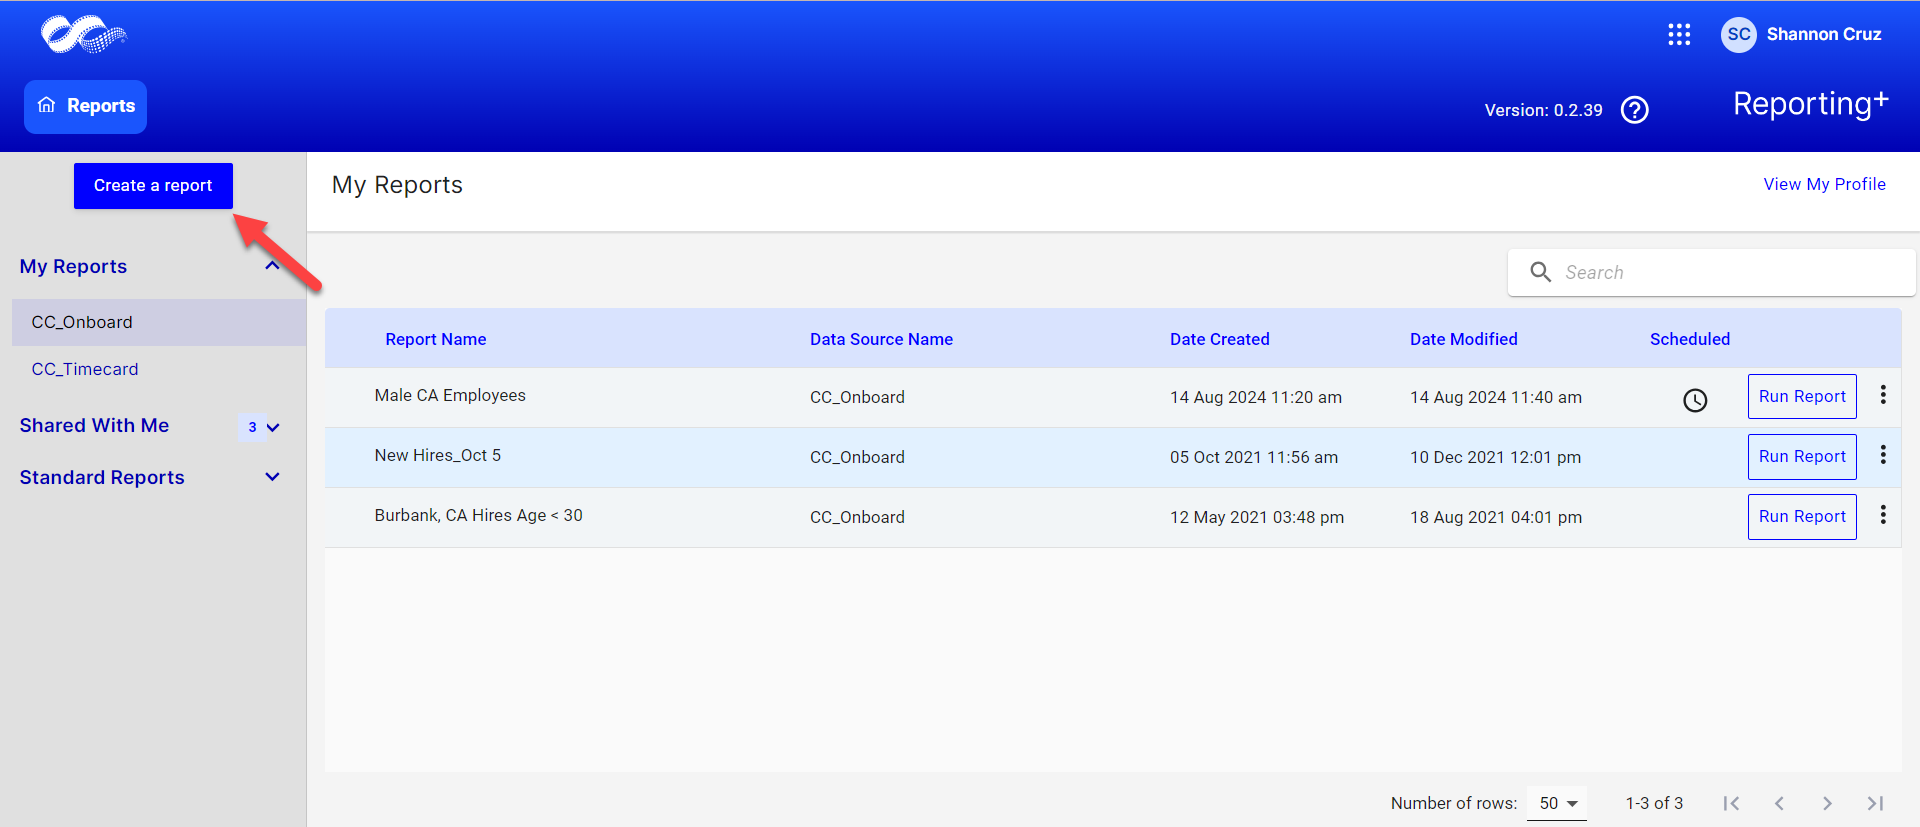
- To get started, click Create a report, located on the left side of the page.
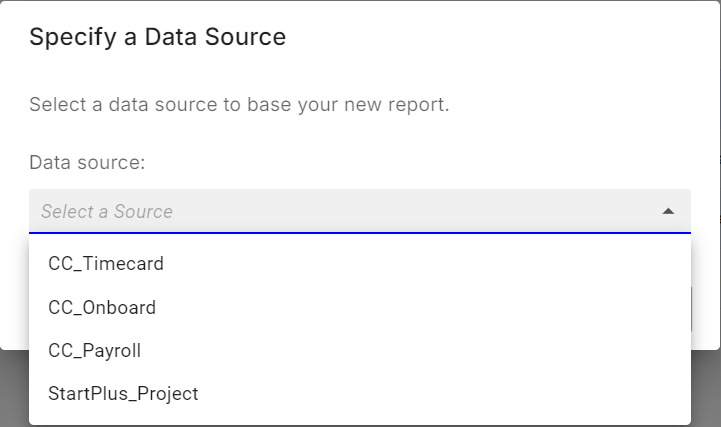
- First, select your data source, the collection of fields that will be added to your report. Then, click Create Report.
- Next, select the project(s) for which you’d like to run a report on. This will help you narrow down your data to apply to only the specified projects.
- 💡 If you have many projects on the list, you can search for a project using the search bar.
- 💡 If you have many projects on the list, you can search for a project using the search bar.
- Once you’ve selected the applicable projects, click the arrow pointing to the right to add them to the table on the right. These projects will be selected for you to run a report on.
- To remove projects, select the projects you’d like to remove and click the arrow pointing to the left.
- To remove projects, select the projects you’d like to remove and click the arrow pointing to the left.
- Click Confirm and Submit.
- You’ll notice the “Quick Start Filters” button at the top of the screen. You can click this button to add or remove projects from the report.
- On the right, there are three boxes that you’ll use to build your report:
- The “Selected Fields” box in the top right will provide a list of fields from the selected data source that will be used in your report.
- The "Values" box allows you to run simple calculations based on selected fields in either data source.
- The “Filters” box in the bottom right allows you to filter the data returned in the report so you only see the data you want to see.
Create a Report With a List of Users and Their Names
- Click Add Field next to the Selected Fields box.
- A drop-down list of available fields sorted alphabetically will be displayed with their data type.
- Note: We offer 3 data types: date, numeric, and text. You can use these to identify the values within a field.
- For example, the "First Name" field is a text data type because the field includes a list of text characters. Fields with both data types, such as specific characters and numeric, will be classified as text data types (i.e., email fields).
- Scroll to find the First Name and Last Name fields and click to select them.
- The First Name and Last Name fields are now available in the Selected Fields box.
- From here, you can move the selected fields around in the box by clicking and dragging a field. This will switch the order of the columns that will be displayed in the report.
- When you’re ready to see a preview of the data, click Preview.
- The preview will return the report. Since we selected two fields, the report will show two columns with a maximum of 1000 records displayed in the report preview.
- Click Download to Excel to download the report and all the supporting data.
Create a Filter
Filters define the report criteria, setting the boundary conditions for the data displayed by your report. Using advanced filter conditions, you can limit the amount of data displayed in a report.
Filters can be saved and reused for a given data source. For example, when a filter is created for the timecard data source, that filter can be reused for any future report you create utilizing the timecard data source. Alternatively, saved filters can be modified to include more conditions and/or even cloned.
Note: Filters created in one data source will not be available in other data sources.
- Click Add filter.
- Give the filter a custom name. A custom filter name is required before the filter can be saved. In our example, we will name our filter City = Los Angeles.
- Filters can be used to eliminate the data you do not need in the report. In our example, we only want to return a list of employees who live in the city of Los Angeles.
- Next, select a condition. Only data that satisfy the filter conditions will be displayed.
- Filters with AND conditions restrict report results to data that matches all AND criteria.
- Filters with OR conditions open report results to include data that matches any OR criteria.
- The following operators are available and can be used with text, numeric or dates
- Equals (=)
- Is less than (<)></)>
- Is greater than ()
- Additional operators are available
- In our example, we selected "Employee Primary City" as our field name, "equals" as our condition, and "LOS ANGELES" as our specified value.
- Click Create and Apply Filter.
- The filter will be added to the current report and it will also be saved and made available for future use in reports created from the same data source.
- Click Preview to preview the report. The page will be refreshed to display the fields you selected and the appropriate data.
- If the preview looks good to you, click Save Report.
- Important: Remember to save your report. Your report will not save if you do not click Save before closing the report
- Give the report a name in the "Save Report" pop-up.
- Click Save Report to save it to your "My Reports" list and display on your Reporting+ landing page.
- To learn more about filters, see How to Create a Filter (With Examples).
Steps for New Experience
Watch Video:
- To get started, click + Create new report, located on the rightside of the page.
-
First, select Start from Scratch:
-
Select a data source and then click Continue to Report Builder:
- Configure your desired parameters and click Run Report.
-
Your report will show on the next screen. With the generated report you can:
- Download Report: If you click the arrow, you can choose to download the report in either an Excel file or CSV.
- Save Report: Allows you to enter a custom name and description and save the report to your list of reports in your Reporting+ landing page.
- Customize Report: Allows you to add and edit filters on the report to make sure you see the data you need to see. You can also edit the columns included as well as the order of the columns.
Create a Report With a List of Users and Their Names
First, using the Filters tab in the Customize Report pane, ensure you have the correct project information entered. Then follow the steps below.
-
Click Columns in the Customize Report panel
- Search the list of available columns sorted alphabetically and select:
-
Employee Name
Tip: If you have multiple columns you can use the icon to the left of a column name to drag and drop them into the order you prefer:
-
- When you’re ready to see a preview of the data, click Run Report.
- The preview will return the report.
- From here, you can save to your saved projects list on your landing page to run or edit later, or download the report as an Excel or CSV file.
Create a Filter
Filters define the report criteria, setting the boundary conditions for the data displayed by your report. Using advanced filter conditions, you can limit the amount of data displayed in a report.
-
To add a filter, click + Add Filter in the Customize Report menu:
- Choose the column you'd like to filter:
- Choose an operator and then select the values you'd like to filter to, and lastly click + Add:
- You can filter the report within Reporting+ and then download the report with those filters applied.
-
Once your filters are added, click Run Report to see the updated report with your added filters: